(For additional information about this page call 052-8795920)
Updated: 19 April 2026, 6:17
Year 2025-2026
TOTAL: 317.2
Percentage (of annual average, last 20 years = 266.8 mm): 121.19%
April (9.7 mm)
1 3.5 mm (Day = 1.0 / Night = 2.5; estimated time of day)
2 3.1 mm (Day = 1.9 / Night = 1.2)
7 2.7 mm (Day = 2.7)
17 0.4 mm (Day = 0.4)
March (53.9 mm)
14 0.3 mm (Night = 0.3)
18 2.0 mm (Day = 2.0)
19 1.0 mm (Day = 0.4 / Night = 0.6)
20 1.6 mm (Night = 1.6)
21 11.0 mm (Day = 4.9 / Night = 6.1)
25 16.8 mm (Day = 5.5 / Night = 11.3)
26 17.0 mm (Day = 13.2 / Night = 3.8)
29 3.3 mm (Day = 3.3)
31 0.9 mm (Night = 0.9)
February (22.1 mm)
3 8.3 mm (Day = 8.3)
18 0.3 mm (Night = 0.3)
23 13.2 mm (Night = 13.2)
23 0.3 mm (Day = 0.3)
January (67.6 mm)
1 11.4 mm (Night = 11.4)
2 0.6 mm (Day = 0.6)
8 7.1 mm (Night = 7.1)
9 12.1 mm (Day = 11.2 / Night = 0.9)
13 28.5 mm (Day = 24 / Night = 4.5)
18 5.5 mm (Day = 2.0 / Night = 3.5)
28 2.4 mm (Day = 1.8 / Night = 0.6)
December (134.6 mm)
9 7.5 mm (Night = 7.5)
10 10.4 mm (Day = 1.4 / Night = 9.0)
11 28.4 mm (Day = 11.3 / Night = 17.1)
12 2.6 mm (Day = 2.3 / Night = 0.3)
15 11.8 mm (estimated date)
16 10 mm (estimated date)
27 34.3 mm (Day = 3.9 / Night = 30.4)
28 9.0 mm (Day = 8.4 / Night = 0.6)
29 20.6 mm (Day = 20.2 / Night = 0.4)
November (29.3 mm)
14 13.0 (estimated date)
15 2.2 (estimated date)
24 12.4
25 1.7
Well, also last year was challenging from all perspectives. Let’s hope that the coming year brings more hope, joy, and much-needed rain…
Year 2024-2025
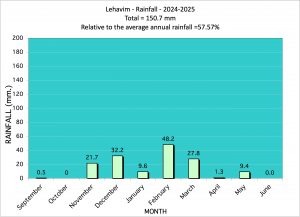
Total: 150.7 mm
Percentage (of annual average, last 20 years = 266.8 mm): 56.49 %
May (9.4 mm)
April (1.3 mm)
March (27.8 mm)
February (48.2 mm)
January (9.6 mm)
December (32.2 mm)
November (15.6 mm)
October (0.0 mm)
September (0.5 mm)
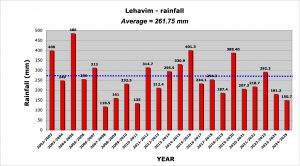
Lehavim’s rainfall in the last 23 years (2002-2025):
Year 2023-2024
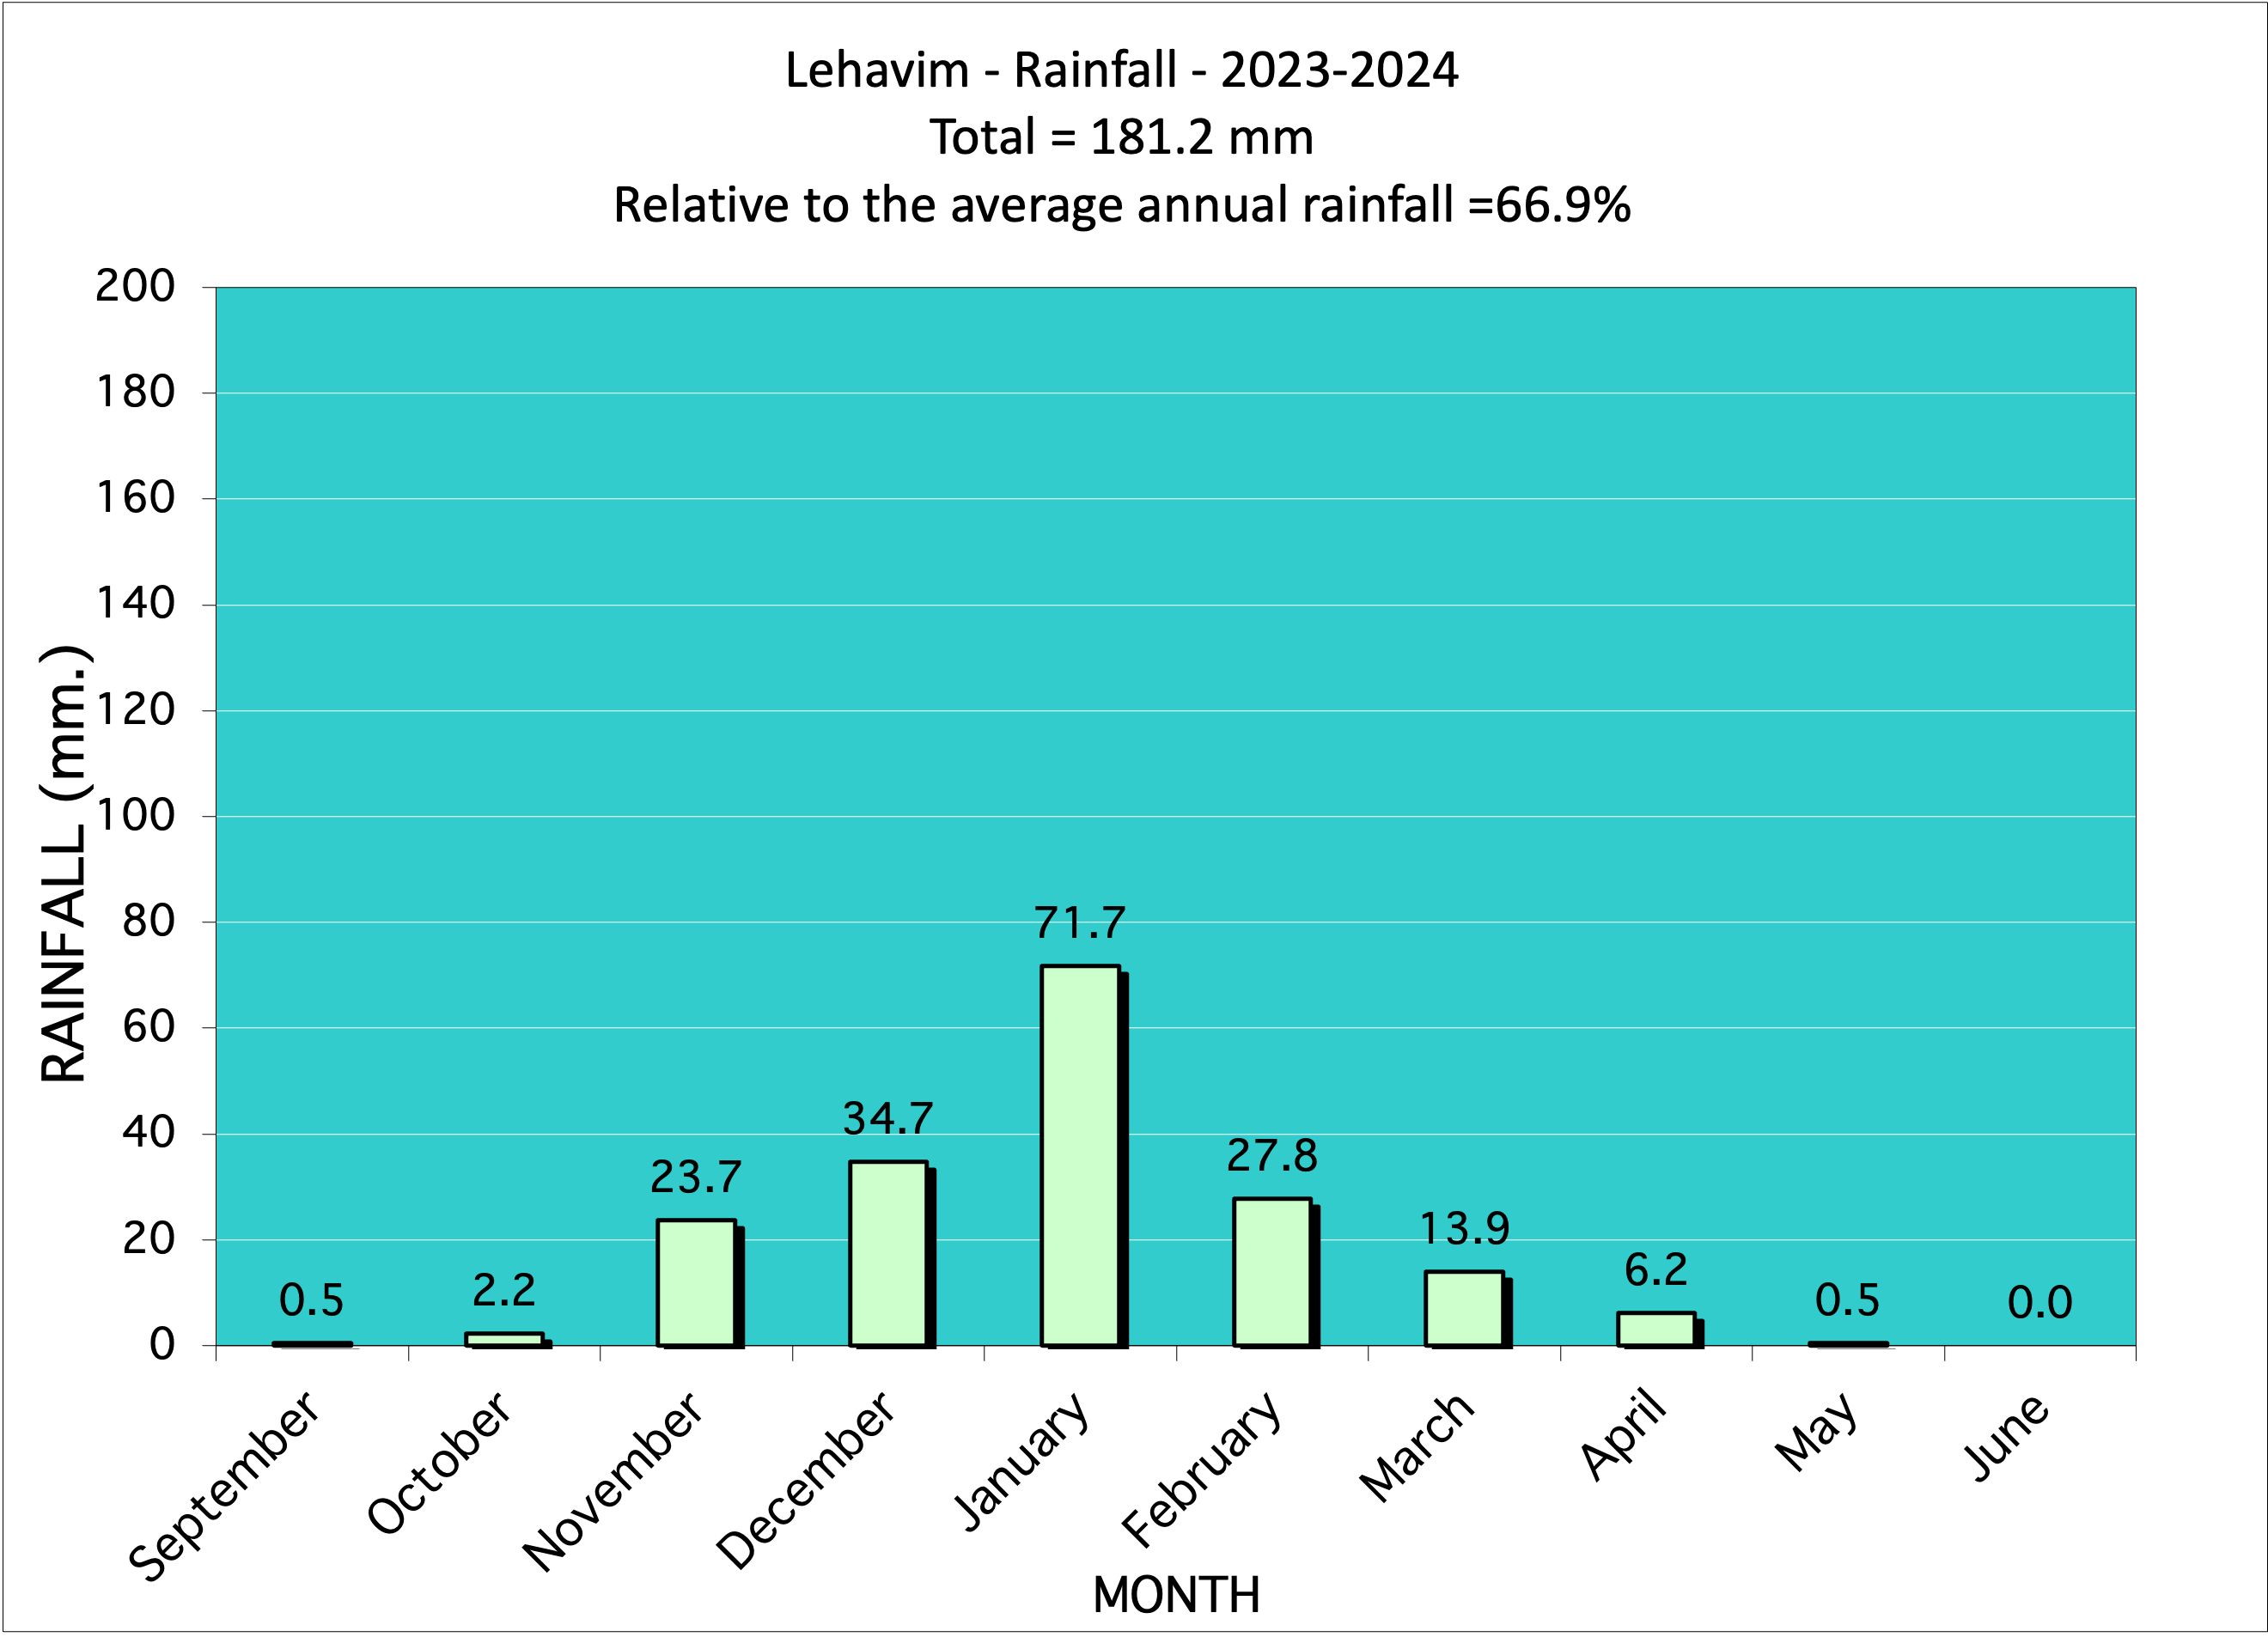
Total: 181.2 mm
Percentage (of annual average, last 20 years = 270.87 mm): 66.9 %
May (0.5)
April (6.2)
March (13.9)
February (27.8)
January (71.7)
December (34.7 mm)
November (23.7 mm)
October (2.2 mm)
September (0.5 mm)
Year 2022-2023
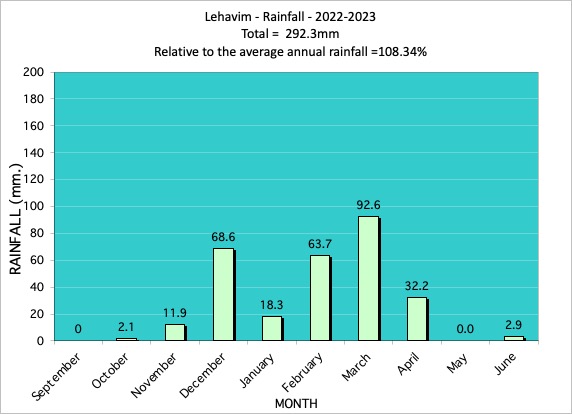
Total: 292.3 mm
Percentage (of annual average, last 20 years = 269.80 mm): 109.34%
June (2.9)
May (o.o)
April (32.2)
March (92.6)
February (63.7)
January (18.3)
December (68.6)
November (11.9)
October (2.1 mm)
Year 2021-2022

Total: 218.7 mm
Percentage (of annual average = 272.49 mm): 80.26%
March (40.0 mm)
February (44.8 mm)
January (89.3 mm)
December (37.9 mm)
November (3.2 mm)
October (0 mm)
September (3.5 mm)
Year 2020-2021
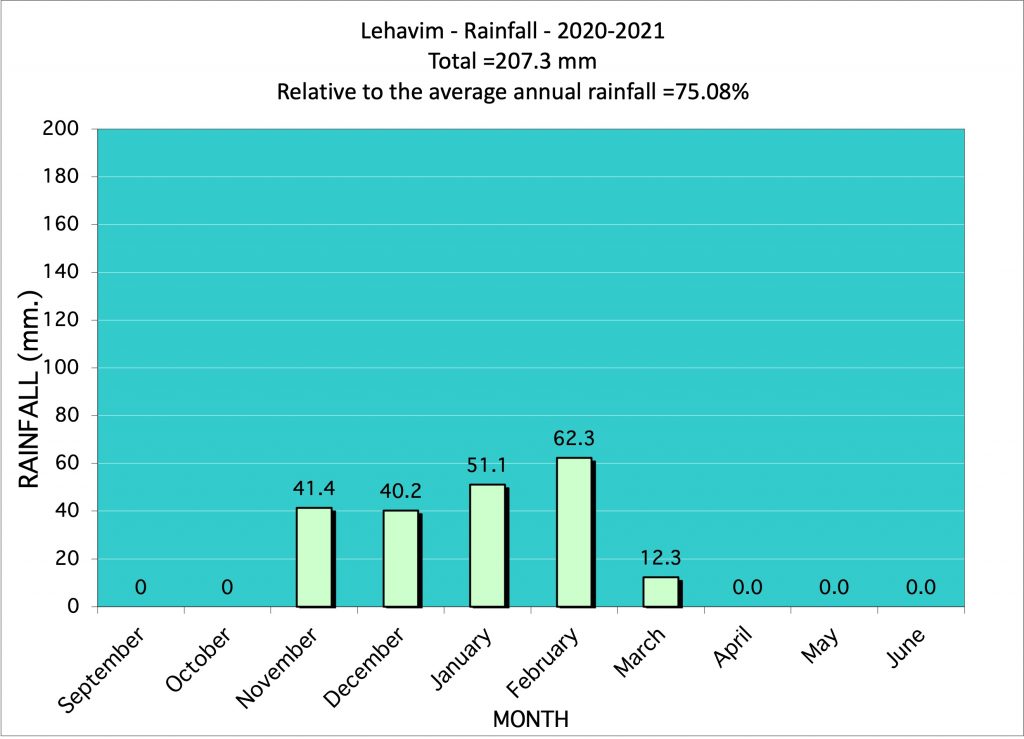
Total: 207.3 mm
Percentage (of annual average = 276.11 mm): 75.08%
March (12.3 mm)
February (62.3 mm)
January (51.1 mm)
December (40.2 mm)
November (41.4 mm)
Year 2019-2020
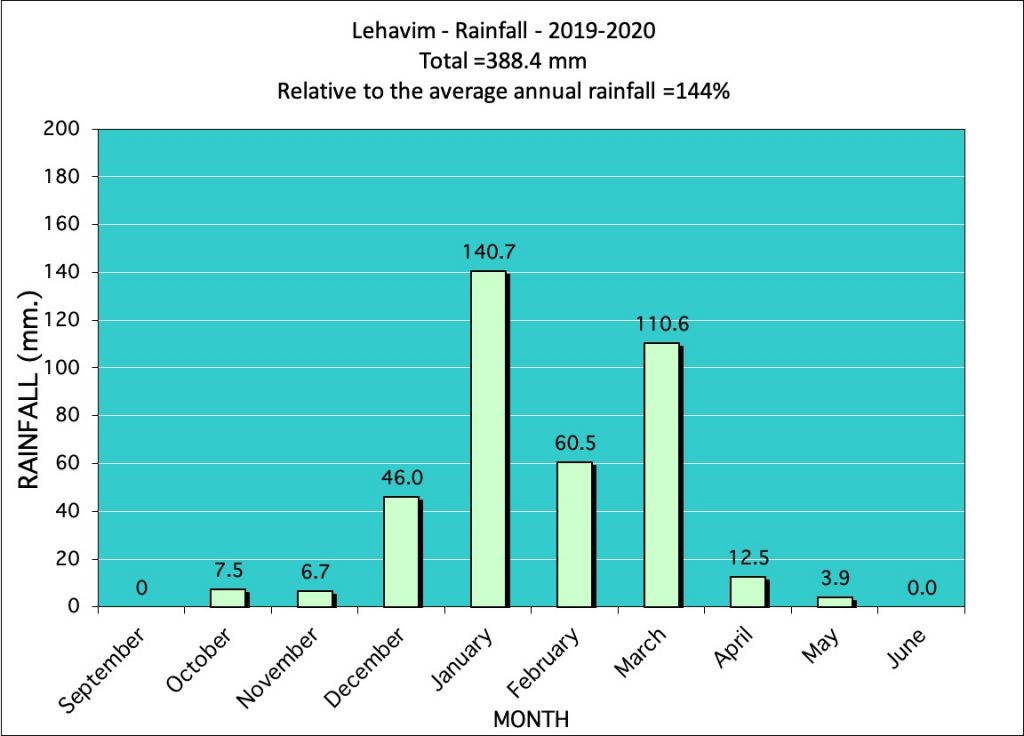
Total: 388.4 mm
Percentage (of annual average = 269.51 mm): 144.12%
May (3.6 mm)
April (12.5 mm)
March (110.6 mm)
February (60.5 mm)
January (140.7 mm)
December (46.0 mm)
November (6.7 mm)
October (7.5 mm)